
Open data · 2017–2026
Every published field result
Every HyperSound result we have published since 2017: 29 results, the small gains included, 24 of them from 12 locations in Canada and the United States. Most compare treated with untreated side by side; 3 are marked as before-and-after or without a control. Each names its source.
Corn, 2020–2026
30comparisons
published corn comparisons since 2020 (no trial in 2024)
30of 30
came out ahead of the untreated control
2022: 10 plots in 5 location averages; every location average was ahead.
+9.1bu/A
mean gain across all 30 comparisons
+2.3
to +20.6bu/A
range from the smallest to the largest gain
+4.8%
median gain in the 20 comparisons with both yields documented (+2.3 to +11.2 %)
Trials in detail
Three trials in detail
Two trials have their own page with all numbers and the source: Precision Planting’s study at its PTI Farm and the variety trial on Terry Good’s farm, weighed by Midwest Co-op FS. New in 2026: a replicated trial at BlackCreek Research, an independent research farm in Ontario.


In use · 2026
On farms in 2026
Terry Good’s photos from 5 farms in Canada and the United States show the Egg at work in 2026. Before planting, the seed runs through it once, from one box into the other.
Twin Ridge Farms: only the province is known (Manitoba); the point marks it roughly.
Outlines: Natural Earth (public domain), simplified. Albers equal-area projection.


Results from these farms follow after the harvest. The variety trial in Meaford is already measured: Ontario trial 2026
Photos and video still: Terry Good, 2026.
How to read these results
Two strips, one field, one difference
Every result on this page is a strip comparison. This is how the method works.
Same field, side by side
One strip is planted with treated seed or watered with treated water. The strip next to it stays untreated.
Weigh both at harvest
Each strip is harvested and weighed. Corn and soybeans are given in bushels per acre (bu/A), potatoes in hundredweight per acre (cwt/A).
Gain = treated minus untreated
The gain is the difference between the two strips. Where both yields are known, we also give it in percent of the untreated strip.
Untreated strip
258.1 bu/A
HyperSound strip
264.1 bu/A
Study facts
- Run by
- Precision Planting ran and reported the PTI Farm trial (2025). All other results come from partner farms; on Terry Good’s farm in Ontario (2026) Midwest Co-op FS weighed every strip.
- Seasons and locations
- Most comparisons: one season at one location
- Replications
- Where stated, at most 6 per comparison. Terry’s field plan repeats each pair three times.
- Values 2017–2023
- Yields as published on this website; 5 corn results of 2023 as listed on Terry Good’s summary sheet of that year. 4 values are recalculated from these yields (see Corrections).
- Corn 2022
- Location averages; only the gain was published. 10 plots in 5 location averages; every location average was ahead.
- Outside field crops
- Before-and-after comparisons and one value without an untreated control; their cards say so.
Two kinds of trials
- Third-party trial
- Run and reported by others: Precision Planting at its PTI Farm in Illinois (2025).
- Partner-farm trial
- Strip comparisons on farms that work with us, as reported to us and published on this website. On Terry Good’s farm in Ontario (2026) Midwest Co-op FS weighed every strip.
Explore
Filter every result
Choose a crop, a year, a region or a trial type. The map, the charts, the result cards and the data table follow your choice.
All results are shown below. Filters need JavaScript.
Showing 29 of 29 results
Change filtersMap
Where the trials took place
12 locations in Canada and the United States. Select a location on the map or in the list to show only its results.
Outlines: Natural Earth (public domain), simplified. Albers equal-area projection.
Southern Ontario
All locations
Maroa, Illinois
- Corn · 5 comparisons · +2.3 to +12.0 bu/A
2022, 2023
Pontiac, Illinois
- Corn · 1 comparison · +6.0 bu/A
- Soybeans · 1 result · +0.7 bu/A
2025
Farmland, Indiana
- Corn · 1 comparison · +7.2 bu/A
2026
Cypress River, Manitoba
- Corn · 1 comparison · +8.5 bu/A
- Potatoes · 1 result · +9.0 cwt/A
2023
Plum Coulee, Manitoba
- Potatoes · 1 result · +8.4 cwt/A
2023
Meaford, Ontario
- Corn · 11 comparisons · +5.3 to +20.6 bu/A
2020, 2022, 2023, 2026
Chatham, Ontario
- Corn · 4 comparisons · +4.6 to +11.5 bu/A
2022, 2023, 2026
St Joachim, Ontario
- Corn · 4 comparisons · +11.0 to +16.0 bu/A
2022, 2023
Bright, Ontario
- Corn · 1 comparison · +7.4 bu/A
2026
Shakespeare, Ontario
- Corn · 1 comparison · +10.8 bu/A
2023
Everett, Ontario
- Potatoes · 1 result · +36.3 cwt/A
2022
Thedford, Ontario
- Corn · 1 comparison · +7.0 bu/A
2023
Not on the map
These results appear in the result cards and the data table. They are not on the map.
Germany
- Other · 2 results
2017, 2019
Location not stated
- Other · 1 result
2019
Charts
Every comparison at a glance
Each dot or bar is one published result. Results outside your filter fade out.
Corn: gain over the untreated control, 2020–2026
One dot per comparison or location average. Point at a dot, tap it or tab to it for details.
* 2024: no trials because of production issues.
Show the data as a table
| Year | Location | Hybrid | Control bu/A | HyperSound bu/A | Gain bu/A | Gain % | Comparisons | Run by |
|---|---|---|---|---|---|---|---|---|
| 2020 | Meaford, Ontario | Pioneer 9330 | 185.5 | 206.1 | +20.6 | +11.1 % | 1 | Partner farm |
| 2022 | St Joachim, Ontario | – | – | – | +11.0 | – | 3 | Partner farm |
| 2022 | Meaford, Ontario | – | – | – | +7.5 | – | 2 | Partner farm |
| 2022 | Chatham, Ontario | non-GMO | – | – | +7.0 | – | 1 | Partner farm |
| 2022 | Chatham, Ontario | GMO | – | – | +4.6 | – | 1 | Partner farm |
| 2022 | Maroa, Illinois | – | – | – | +2.3 | – | 3 | Partner farm |
| 2023 | Mark Shiller, St Joachim, Ontario | – | 161.0 | 177.0 | +16.0 | +9.9 % | 1 | Partner farm |
| 2023 | Terry Hoffman Farms, Maroa, Illinois | Prairie Hybrids 729 | 203.0 | 215.0 | +12.0 | +5.9 % | 1 | Partner farm |
| 2023 | Joe Wecker, Chatham, Ontario | non-GMO | 230.8 | 242.3 | +11.5 | +5.0 % | 1 | Partner farm |
| 2023 | Dietmar Walsh, Shakespeare, Ontario | – | 192.6 | 203.4 | +10.8 | +5.6 % | 1 | Partner farm |
| 2023 | Terry Hoffman Farms, Maroa, Illinois | Prairie Hybrids 8751 | 218.0 | 227.0 | +9.0 | +4.1 % | 1 | Partner farm |
| 2023 | Mitchell Good Farm, Meaford, Ontario | Pioneer | 193.8 | 202.6 | +8.8 | +4.5 % | 1 | Partner farm |
| 2023 | Under The Hill Farms, Cypress River, Manitoba | GMO | 190.0 | 198.5 | +8.5 | +4.5 % | 1 | Partner farm |
| 2023 | Ungerer Farms, Thedford, Ontario | GMO | 216.0 | 223.0 | +7.0 | +3.2 % | 1 | Partner farm |
| 2023 | Buford Farms, Meaford, Ontario | Pioneer 8407 | 199.3 | 204.7 | +5.4 | +2.7 % | 1 | Partner farm |
| 2025 | PTI Farm (Precision Technology Institute), Pontiac, Illinois | DKC 56-26 | 258.1 | 264.1 | +6.0 | +2.3 % | 1 | Third party |
| 2026 | Good Family Farms, Meaford, Ontario | Saatbau Casandro | 141.6 | 157.5 | +15.9 | +11.2 % | 1 | Partner farm |
| 2026 | Good Family Farms, Meaford, Ontario | Saatbau Amello | 138.2 | 151.6 | +13.4 | +9.7 % | 1 | Partner farm |
| 2026 | Good Family Farms, Meaford, Ontario | Pioneer 8704 (pair A) | 156.0 | 168.4 | +12.4 | +7.9 % | 1 | Partner farm |
| 2026 | Good Family Farms, Meaford, Ontario | Pioneer 8704 (pair B) | 163.5 | 174.4 | +10.9 | +6.7 % | 1 | Partner farm |
| 2026 | Good Family Farms, Meaford, Ontario | Dedell 1815 | 172.6 | 182.1 | +9.5 | +5.5 % | 1 | Partner farm |
| 2026 | Joe Wecker, Chatham, Ontario | – | 227.0 | 235.0 | +8.0 | +3.5 % | 1 | Partner farm |
| 2026 | BlackCreek Research, Bright, Ontario | Pioneer P9955V | 159.9 | 167.3 | +7.4 | +4.6 % | 1 | Third party |
| 2026 | Ryan Chalfant, Farmland, Indiana | – | 196.4 | 203.6 | +7.2 | +3.7 % | 1 | Partner farm |
| 2026 | Good Family Farms, Meaford, Ontario | Saatbau Medino | 161.5 | 166.8 | +5.3 | +3.3 % | 1 | Partner farm |
| Partner-farm results 2020–2023 use the yields as published on this website, 5 results of 2023 as listed on Terry Good’s summary sheet. The 2022 rows are location averages; only the gain was published. No trials in 2024. | ||||||||
Corn in this selection: 30 comparisons, 30 of 30 ahead of the untreated control, mean gain +9.1 bu/A, range +2.3 to +20.6 bu/A.
2022: 10 plots in 5 location averages; every location average was ahead.
Every result
Every result, one card each
Grouped by crop. Each card names the location, the trial type, how the result was measured and where it was published.
No result matches these filters.
Corn 22 results
Good Family Farms, Meaford, Ontario
6 variety pairs, one strip each
+11.2 bu/A mean
6 of 6 pairs ahead · range +5.3 to +15.9 bu/A · +7.2 %
Variety trial on Terry Good’s farm, measured independently by Midwest Co-op FS, on an organic field in a dry year. Strips of 20 × 395 ft. Dry yield at 15 % moisture.
Details
- Measured
- dry yield at 15 % moisture
- Replications
- 1
- Applied to
- not stated
- Management
- organic
- Planted / harvested
- May 29 – Nov 10, 2026
Source: Variety trial result sheet 2026 (Midwest Co-op FS) · Original document on file
Joe Wecker, Chatham, Ontario
+8.0 bu/A
+3.5 % · 227.0 → 235.0 bu/A
Plot trial on a partner farm. Reported by the farm; the data sheet is pending. Treatment route not stated.
Details
- Measured
- yield
- Replications
- not stated
- Applied to
- not stated
Source: Message from Terry Good to Felix Scheffel, Nov 15, 2026 (farm results, data sheet pending) · Reported by the farm, data sheet pending
BlackCreek Research, Bright, Ontario
Pioneer P9955V
+7.4 bu/A
+4.6 % · 159.9 → 167.3 bu/A
Also published: higher vigour score in June (5.7 vs 5.0) and July (5.8 vs 5.0), statistically significant; grain 1.2 points drier at harvest (20.1 % vs 21.3 %), statistically significant
Conducted and measured by BlackCreek Research, an independent research farm. Randomized complete block, six replications; average of all six replications, as published in the final report; yield at 15.5 % moisture.
Details
- Measured
- yield
- Replications
- 6
- Applied to
- seed
- Planted / harvested
- May 8 – Nov 2, 2026
Source: BlackCreek Research, trial TK26N01, final report, Nov 18, 2026 · Original document on file
Ryan Chalfant, Farmland, Indiana
+7.2 bu/A
+3.7 % · 196.4 → 203.6 bu/A
Plot trial on a partner farm. Reported by the farm; the data sheet is pending. Treatment route not stated.
Details
- Measured
- yield
- Replications
- not stated
- Applied to
- not stated
Source: Message from Terry Good to Felix Scheffel, Nov 15, 2026 (farm results, data sheet pending) · Reported by the farm, data sheet pending
PTI Farm (Precision Technology Institute), Pontiac, Illinois
DKC 56-26
+6.0 bu/A
+2.3 % · 258.1 → 264.1 bu/A
Seed treatment study. Seed passed through a 3-inch HyperSound Egg. Replications are not stated on the report page.
Details
- Measured
- yield
- Replications
- not stated
- Applied to
- seed
- Planted
- May 10, 2025
Source: Precision Planting, 2025 PTI Results, page 55 · Original document on file
Mark Shiller, St Joachim, Ontario
+16.0 bu/A
+9.9 % · 161.0 → 177.0 bu/A
Organic corn, 2 plots, as listed on the 2023 summary sheet.
Details
- Measured
- dry yield
- Replications
- 2
- Applied to
- seed
- Management
- organic
Source: Corn demonstration plots 2023, summary sheet (Terry Good) · Original document on file
Terry Hoffman Farms, Maroa, Illinois
Prairie Hybrids 729
+12.0 bu/A
+5.9 % · 203.0 → 215.0 bu/A
Organic demonstration plot, two replications.
Details
- Measured
- marketable yield
- Replications
- 2
- Applied to
- seed
- Management
- organic
- Planted / harvested
- May 20 – Oct 26, 2023
Source: wise-lifestyle.net, “Test Plots 2023” · As published on this website
On Terry Good’s 2023 summary sheet, Maroa is a single line, the average of its 2 plots: 210.5 → 221.0 bu/A (+10.5 bu/A). Here each trial counts once, card by card.
Joe Wecker, Chatham, Ontario
non-GMO
+11.5 bu/A
+5.0 % · 230.8 → 242.3 bu/A
Conventional non-GMO corn, 1 plot, as listed on the 2023 summary sheet.
Details
- Measured
- dry yield
- Replications
- 1
- Applied to
- seed
- Management
- conventional
Source: Corn demonstration plots 2023, summary sheet (Terry Good) · Original document on file
Dietmar Walsh, Shakespeare, Ontario
+10.8 bu/A
+5.6 % · 192.6 → 203.4 bu/A
Organic corn, 3 plots, as listed on the 2023 summary sheet.
Details
- Measured
- dry yield
- Replications
- 3
- Applied to
- seed
- Management
- organic
Source: Corn demonstration plots 2023, summary sheet (Terry Good) · Original document on file
Terry Hoffman Farms, Maroa, Illinois
Prairie Hybrids 8751
+9.0 bu/A
+4.1 % · 218.0 → 227.0 bu/A
Organic demonstration plot, two replications.
Details
- Measured
- marketable yield
- Replications
- 2
- Applied to
- seed
- Management
- organic
- Planted / harvested
- May 20 – Oct 26, 2023
Source: wise-lifestyle.net, “Test Plots 2023” · As published on this website
On Terry Good’s 2023 summary sheet, Maroa is a single line, the average of its 2 plots: 210.5 → 221.0 bu/A (+10.5 bu/A). Here each trial counts once, card by card.
Mitchell Good Farm, Meaford, Ontario
Pioneer
+8.8 bu/A
+4.5 % · 193.8 → 202.6 bu/A
Organic demonstration plot, three replications.
Details
- Measured
- marketable yield
- Replications
- 3
- Applied to
- seed
- Management
- organic
- Planted / harvested
- May 28 – Nov 3, 2023
Source: wise-lifestyle.net, “Test Plots 2023” · As published on this website
On Terry Good’s 2023 summary sheet, Meaford is a single line that combines 3 farms of Good Family Farms: 7 plots, 198.0 → 206.0 bu/A (+8.0 bu/A). Here each trial counts once, card by card.
Under The Hill Farms, Cypress River, Manitoba
GMO
+8.5 bu/A
+4.5 % · 190.0 → 198.5 bu/A
GMO corn, 6 plots, as listed on the 2023 summary sheet.
Details
- Measured
- dry yield
- Replications
- 6
- Applied to
- seed
- Management
- conventional
Source: Corn demonstration plots 2023, summary sheet (Terry Good) · Original document on file
Ungerer Farms, Thedford, Ontario
GMO
+7.0 bu/A
+3.2 % · 216.0 → 223.0 bu/A
GMO corn, 1 plot, as listed on the 2023 summary sheet.
Details
- Measured
- dry yield
- Replications
- 1
- Applied to
- seed
- Management
- conventional
Source: Corn demonstration plots 2023, summary sheet (Terry Good) · Original document on file
Buford Farms, Meaford, Ontario
Pioneer 8407
+5.4 bu/A
+2.7 % · 199.3 → 204.7 bu/A
Organic demonstration plot, two replications.
Details
- Measured
- marketable yield
- Replications
- 2
- Applied to
- seed
- Management
- organic
- Planted / harvested
- May 29 – Nov 2, 2023
Source: wise-lifestyle.net, “Test Plots 2023” · As published on this website
On Terry Good’s 2023 summary sheet, Meaford is a single line that combines 3 farms of Good Family Farms: 7 plots, 198.0 → 206.0 bu/A (+8.0 bu/A). Here each trial counts once, card by card.
Norwich, Ontario
+38.5 bu/A
average of 2 plots
Average of 2 plots: 1 organic, 1 conventional. Only the yield gain was published.
Details
- Measured
- yield
- Replications
- not stated
- Applied to
- seed
- Management
- organic and conventional
Source: wise-lifestyle.net, “Testimonials” · As published on this website
St Joachim, Ontario
+11.0 bu/A
average of 3 plots
Average of 3 organic plots. Only the yield gain was published.
Details
- Measured
- yield
- Replications
- not stated
- Applied to
- seed
- Management
- organic
Source: wise-lifestyle.net, “Testimonials” · As published on this website
Meaford, Ontario
+7.5 bu/A
average of 2 plots
Average of 2 organic plots. Only the yield gain was published.
Details
- Measured
- yield
- Replications
- not stated
- Applied to
- seed
- Management
- organic
Source: wise-lifestyle.net, “Testimonials” · As published on this website
Chatham, Ontario
non-GMO
+7.0 bu/A
1 conventional non-GMO plot. Only the yield gain was published.
Details
- Measured
- yield
- Replications
- not stated
- Applied to
- seed
- Management
- conventional
Source: wise-lifestyle.net, “Testimonials” · As published on this website
Chatham, Ontario
GMO
+4.6 bu/A
1 conventional GMO plot. Only the yield gain was published.
Details
- Measured
- yield
- Replications
- not stated
- Applied to
- seed
- Management
- conventional
Source: wise-lifestyle.net, “Testimonials” · As published on this website
Maroa, Illinois
+2.3 bu/A
average of 3 plots
Average of 3 plots: 1 organic, 2 conventional. Only the yield gain was published.
Details
- Measured
- yield
- Replications
- not stated
- Applied to
- seed
- Management
- organic and conventional
Source: wise-lifestyle.net, “Testimonials” · As published on this website
Meaford, Ontario
Pioneer 9188
+37.6 bu/A
+21.9 % · 171.4 → 209.0 bu/A
Organic demonstration plot, two replications.
Details
- Measured
- dry yield
- Replications
- 2
- Applied to
- seed
- Management
- organic
- Planted / harvested
- May 14 – Nov 5, 2021
Source: wise-lifestyle.net, “Testimonials” · As published on this website
Meaford, Ontario
Pioneer 9330
+20.6 bu/A
+11.1 % · 185.5 → 206.1 bu/A
Organic demonstration plot, two replications.
Details
- Measured
- dry yield
- Replications
- 2
- Applied to
- seed
- Management
- organic
- Planted / harvested
- May 22 – Oct 28, 2020
Source: wise-lifestyle.net, “Testimonials” · As published on this website
Soybeans 1 result
PTI Farm (Precision Technology Institute), Pontiac, Illinois
Pioneer 37Z06E
+0.7 bu/A
+0.8 % · 91.6 → 92.3 bu/A
Irrigation study. Irrigation water passed through the HyperSound Egg. Replications are not stated on the report page.
Details
- Measured
- yield
- Replications
- not stated
- Applied to
- water
- Planted
- April 18, 2025
Source: Precision Planting, 2025 PTI Results, page 251 · Original document on file
Other uses 3 results
Location not stated
Mushrooms
+1.3 kg/m²
+8.0 % · 16.856 → 18.2 kg/m²
Also published: 21 % fewer grade-2 mushrooms over the trial (as published)
Commercial grower. Irrigation water recirculated through the device. Average yield before installation compared with July–October 2019. A before-and-after comparison.
Details
- Measured
- yield per square meter
- Applied to
- water
Source: wise-lifestyle.net, “Testimonials” · As published on this website
In the grower’s own words:
“Use of the HyperSound Technology increased our yield beyond our expectations, giving us a significant return on investment.”
Germany
Oat-pea mixture for biogas
36.6 % dry matter content (lab test)
No untreated control. This value is not a comparison.
Seed and cow manure were treated. Lab test (LUFA): 36.6 % dry matter. No untreated control; the page compares with a typical range of 20–25 %.
Details
- Measured
- dry matter content (lab test)
- Applied to
- seed
Source: wise-lifestyle.net, “Testimonials” · As published on this website
Germany
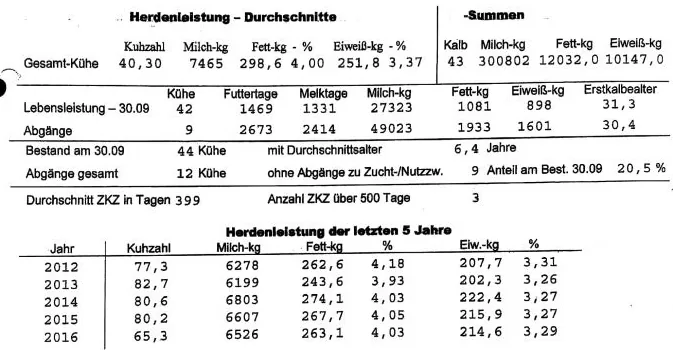
Dairy herd: milk per cow
+939 kg/cow
+14.4 % · 6,526 → 7,465 kg/cow
Also published: milk fat per cow +13.5 %; milk protein per cow +17.3 %
Herd averages per cow, Oct 2015 – Sep 2016 (tap water) compared with Oct 2016 – Sep 2017 (drinking water passed through HyperSound). A before-and-after comparison, not a side-by-side trial.
Details
- Measured
- milk per cow and year
- Applied to
- water
Source: wise-lifestyle.net, “Testimonials” · As published on this website
Herd averages per cow from the annual report of LKV Bayern, the dairy herd recording organization in Bavaria:
Potatoes 3 results
Cypress River, Manitoba
Russet Ranger
+9.0 cwt/A
+1.9 % · 475.0 → 484.0 cwt/A
On-farm trial, harvest plots of 4–6 acres, 2 replications.
Details
- Measured
- marketable yield
- Replications
- 2
- Applied to
- seed
- Planted / harvested
- May – Sep 2023
Source: wise-lifestyle.net, “Test Plots 2023” · As published on this website
As published in 2023, at a potato price of about $0.17/lb: +$153.00 more revenue per acre.
Plum Coulee, Manitoba
Russet Ranger
+8.4 cwt/A
+1.7 % · 488.3 → 496.7 cwt/A
On-farm trial, harvest plots of 4–6 acres, 3 replications.
Details
- Measured
- marketable yield
- Replications
- 3
- Applied to
- seed
- Planted / harvested
- May – Sep 2023
Source: wise-lifestyle.net, “Test Plots 2023” · As published on this website
As published in 2023, at a potato price of about $0.17/lb: +$142.80 more revenue per acre.
Everett, Ontario
SP327
+36.3 cwt/A
+19.2 % · 193.4 → 229.7 cwt/A
Marketable yield: +43.8 cwt/A (+29.5 %)
Treated and untreated seed planted in side-by-side strips of about 0.5 acre each. Three 10-ft sections per strip were hand-harvested and weighed.
Details
- Measured
- total yield
- Replications
- not stated
- Applied to
- seed
- Management
- organic
- Planted / harvested
- May 30 – Oct 5, 2022
Source: wise-lifestyle.net, “Testimonials” · As published on this website
Open data
The data behind this page
All 33 rows of our data, including second measurements and values without a control. Download the same data as a file and check every number yourself.
33 rows · 30 columns · 13 KB · UTF-8, comma-separated
What the columns in the file mean
id- Short name of the result
crop, crop_detail- corn, soybeans, potatoes or other, with detail
year, country, region, location, latitude, longitude- Where and when; coordinates of the town
organization- Farm or organization, only where we have permission to name it
variety, measure, unit- Variety, what was weighed, unit
control, hypersound, gain, gain_pct- Untreated strip, treated strip, difference, difference in percent of the control
comparisons, replications- Number of strip pairs behind the value; replications where stated
run_by- third-party or partner-farm
applied_to- seed, water or unknown (not stated in the source)
management, planted, harvested, plot_acres- As stated in the source
source, source_page, source_url, source_status- Where the value was published and whether we hold the original document
note- Short public note
| Year | Crop | Location | Measure | Variety | Control | HyperSound | Gain | Gain % | Unit | Comparisons | Run by | Applied to | Source |
|---|---|---|---|---|---|---|---|---|---|---|---|---|---|
| 2026 | Corn | Good Family Farms, Meaford, Ontario | dry yield at 15 % moisture | Saatbau Casandro | 141.6 | 157.5 | +15.9 | +11.2 % | bu/A | 1 | Partner farm | not stated | Variety trial result sheet 2026 (Midwest Co-op FS) |
| 2026 | Corn | Good Family Farms, Meaford, Ontario | dry yield at 15 % moisture | Saatbau Amello | 138.2 | 151.6 | +13.4 | +9.7 % | bu/A | 1 | Partner farm | not stated | Variety trial result sheet 2026 (Midwest Co-op FS) |
| 2026 | Corn | Good Family Farms, Meaford, Ontario | dry yield at 15 % moisture | Pioneer 8704 (pair A) | 156.0 | 168.4 | +12.4 | +7.9 % | bu/A | 1 | Partner farm | not stated | Variety trial result sheet 2026 (Midwest Co-op FS) |
| 2026 | Corn | Good Family Farms, Meaford, Ontario | dry yield at 15 % moisture | Pioneer 8704 (pair B) | 163.5 | 174.4 | +10.9 | +6.7 % | bu/A | 1 | Partner farm | not stated | Variety trial result sheet 2026 (Midwest Co-op FS) |
| 2026 | Corn | Good Family Farms, Meaford, Ontario | dry yield at 15 % moisture | Dedell 1815 | 172.6 | 182.1 | +9.5 | +5.5 % | bu/A | 1 | Partner farm | not stated | Variety trial result sheet 2026 (Midwest Co-op FS) |
| 2026 | Corn | Joe Wecker, Chatham, Ontario | yield | – | 227.0 | 235.0 | +8.0 | +3.5 % | bu/A | 1 | Partner farm | not stated | Message from Terry Good to Felix Scheffel, Nov 15, 2026 (farm results, data sheet pending) |
| 2026 | Corn | BlackCreek Research, Bright, Ontario | yield | Pioneer P9955V | 159.9 | 167.3 | +7.4 | +4.6 % | bu/A | 1 | Third party | seed | BlackCreek Research, trial TK26N01, final report, Nov 18, 2026 |
| 2026 | Corn | Ryan Chalfant, Farmland, Indiana | yield | – | 196.4 | 203.6 | +7.2 | +3.7 % | bu/A | 1 | Partner farm | not stated | Message from Terry Good to Felix Scheffel, Nov 15, 2026 (farm results, data sheet pending) |
| 2026 | Corn | Good Family Farms, Meaford, Ontario | dry yield at 15 % moisture | Saatbau Medino | 161.5 | 166.8 | +5.3 | +3.3 % | bu/A | 1 | Partner farm | not stated | Variety trial result sheet 2026 (Midwest Co-op FS) |
| 2025 | Corn | PTI Farm (Precision Technology Institute), Pontiac, Illinois | yield | DKC 56-26 | 258.1 | 264.1 | +6.0 | +2.3 % | bu/A | 1 | Third party | seed | Precision Planting, 2025 PTI Results, page 55 |
| 2023 | Corn | Mark Shiller, St Joachim, Ontario | dry yield | – | 161.0 | 177.0 | +16.0 | +9.9 % | bu/A | 1 | Partner farm | seed | Corn demonstration plots 2023, summary sheet (Terry Good) |
| 2023 | Corn | Terry Hoffman Farms, Maroa, Illinois | marketable yield | Prairie Hybrids 729 | 203.0 | 215.0 | +12.0 | +5.9 % | bu/A | 1 | Partner farm | seed | wise-lifestyle.net, “Test Plots 2023” |
| 2023 | Corn | Joe Wecker, Chatham, Ontario | dry yield | non-GMO | 230.8 | 242.3 | +11.5 | +5.0 % | bu/A | 1 | Partner farm | seed | Corn demonstration plots 2023, summary sheet (Terry Good) |
| 2023 | Corn | Dietmar Walsh, Shakespeare, Ontario | dry yield | – | 192.6 | 203.4 | +10.8 | +5.6 % | bu/A | 1 | Partner farm | seed | Corn demonstration plots 2023, summary sheet (Terry Good) |
| 2023 | Corn | Terry Hoffman Farms, Maroa, Illinois | marketable yield | Prairie Hybrids 8751 | 218.0 | 227.0 | +9.0 | +4.1 % | bu/A | 1 | Partner farm | seed | wise-lifestyle.net, “Test Plots 2023” |
| 2023 | Corn | Mitchell Good Farm, Meaford, Ontario | marketable yield | Pioneer | 193.8 | 202.6 | +8.8 | +4.5 % | bu/A | 1 | Partner farm | seed | wise-lifestyle.net, “Test Plots 2023” |
| 2023 | Corn | Under The Hill Farms, Cypress River, Manitoba | dry yield | GMO | 190.0 | 198.5 | +8.5 | +4.5 % | bu/A | 1 | Partner farm | seed | Corn demonstration plots 2023, summary sheet (Terry Good) |
| 2023 | Corn | Ungerer Farms, Thedford, Ontario | dry yield | GMO | 216.0 | 223.0 | +7.0 | +3.2 % | bu/A | 1 | Partner farm | seed | Corn demonstration plots 2023, summary sheet (Terry Good) |
| 2023 | Corn | Buford Farms, Meaford, Ontario | marketable yield | Pioneer 8407 | 199.3 | 204.7 | +5.4 | +2.7 % | bu/A | 1 | Partner farm | seed | wise-lifestyle.net, “Test Plots 2023” |
| 2022 | Corn | St Joachim, Ontario | yield | – | – | – | +11.0 | – | bu/A | 3 | Partner farm | seed | wise-lifestyle.net, “Testimonials” |
| 2022 | Corn | Meaford, Ontario | yield | – | – | – | +7.5 | – | bu/A | 2 | Partner farm | seed | wise-lifestyle.net, “Testimonials” |
| 2022 | Corn | Chatham, Ontario | yield | non-GMO | – | – | +7.0 | – | bu/A | 1 | Partner farm | seed | wise-lifestyle.net, “Testimonials” |
| 2022 | Corn | Chatham, Ontario | yield | GMO | – | – | +4.6 | – | bu/A | 1 | Partner farm | seed | wise-lifestyle.net, “Testimonials” |
| 2022 | Corn | Maroa, Illinois | yield | – | – | – | +2.3 | – | bu/A | 3 | Partner farm | seed | wise-lifestyle.net, “Testimonials” |
| 2020 | Corn | Meaford, Ontario | dry yield | Pioneer 9330 | 185.5 | 206.1 | +20.6 | +11.1 % | bu/A | 1 | Partner farm | seed | wise-lifestyle.net, “Testimonials” |
| 2025 | Soybeans | PTI Farm (Precision Technology Institute), Pontiac, Illinois | yield | Pioneer 37Z06E | 91.6 | 92.3 | +0.7 | +0.8 % | bu/A | 1 | Third party | water | Precision Planting, 2025 PTI Results, page 251 |
| 2019 | Mushrooms | Location not stated | yield per square meter | – | 16.856 | 18.2 | +1.3 | +8.0 % | kg/m² | 1 | Partner farm | water | wise-lifestyle.net, “Testimonials” |
| 2019 | Oat-pea mixture for biogas | Germany | dry matter content (lab test) | – | – | 36.6 | – | – | % | 1 | Partner farm | seed | wise-lifestyle.net, “Testimonials” |
| 2017 | Dairy herd: milk per cow | Germany | milk per cow and year | – | 6,526 | 7,465 | +939 | +14.4 % | kg/cow | 1 | Partner farm | water | wise-lifestyle.net, “Testimonials” |
| 2023 | Potatoes | Cypress River, Manitoba | marketable yield | Russet Ranger | 475.0 | 484.0 | +9.0 | +1.9 % | cwt/A | 1 | Partner farm | seed | wise-lifestyle.net, “Test Plots 2023” |
| 2023 | Potatoes | Plum Coulee, Manitoba | marketable yield | Russet Ranger | 488.3 | 496.7 | +8.4 | +1.7 % | cwt/A | 1 | Partner farm | seed | wise-lifestyle.net, “Test Plots 2023” |
| 2022 | Potatoes | Everett, Ontario | marketable yield | SP327 | 152.2 | 196.0 | +43.8 | +29.5 % | cwt/A | 1 | Partner farm | seed | wise-lifestyle.net, “Testimonials” |
| 2022 | Potatoes | Everett, Ontario | total yield | SP327 | 193.4 | 229.7 | +36.3 | +19.2 % | cwt/A | 1 | Partner farm | seed | wise-lifestyle.net, “Testimonials” |
Gain % = (HyperSound − control) / control, except Everett (percent as published: mean of three sections). Rows in italics are second measurements or values without a control; they are not counted in the corn figures.
Corrections
Where earlier pages were wrong
Our earlier pages rounded or miscalculated some values. This page shows the values recalculated from the published yields.
- Meaford, Ontario, 2020, Pioneer 9330: earlier +10 %, recalculated +11.1 % from 185.5 and 206.1 bu/A.
- Meaford, Ontario, 2021, Pioneer 9188: earlier +18 %, recalculated +21.9 % from 171.4 and 209.0 bu/A.
- Buford Farms, Meaford, Ontario, 2023, Pioneer 8407: earlier +4.3 bu/A, recalculated +5.4 bu/A from 199.3 and 204.7 bu/A.
- Location not stated, 2019, Mushrooms: earlier +7.8 %, recalculated +8.0 % from 16.856 and 18.2 kg/m².
Partner-farm results from 2017 to 2023 use the yields as published on this website; the values above are recalculated from those yields. Each card says whether we hold the original document.
Other crops
Potatoes
Potato trials on partner farms, 2022 and 2023.
Potatoes: gain over the untreated control, in percent
Three partner farms, 2022 and 2023. Everett was weighed by hand in three sections per strip; the Manitoba farms harvested plots of 4–6 acres.
Show the data as a table
| Location | Year | Measure | Control cwt/A | HyperSound cwt/A | Gain cwt/A | Gain % |
|---|---|---|---|---|---|---|
| Everett, Ontario | 2022 | total yield | 193.4 | 229.7 | +36.3 | +19.2 % |
| Everett, Ontario | 2022 | marketable yield | 152.2 | 196.0 | +43.8 | +29.5 % |
| Cypress River, Manitoba | 2023 | marketable yield | 475.0 | 484.0 | +9.0 | +1.9 % |
| Plum Coulee, Manitoba | 2023 | marketable yield | 488.3 | 496.7 | +8.4 | +1.7 % |
| Everett: percent as published, the mean of the three section results. Shown as published on this website. | ||||||
Your farm
Run your own strip trial
Your own field is the test that counts. Leave one strip untreated next to a treated one, weigh both at harvest and compare. We help you plan it.